How to find pesticides in tomatoes

Processing companies can now use Hydra to verify in real time the presence of pesticides in the tomatoes

The tomato, in all its varieties and colors, is undoubtedly one of the most consumed fruits in the world, thanks to its versatility and its agro-sugar balance.

According to the Food and Agriculture Organization of the United Nations (FAO), tomato production has increased by 35.76% in the last ten years; in 2017, a total of 182.301 million tons of tomatoes were produced worldwide. The production and demand for organic tomatoes is also growing fastly, which, according to the estimates of the study conducted by the University of Newcastle and published in the British Journal of Nutrition in 2014, are healthier and more pesticide-free compared to conventional tomatoes.

Can processing companies monitor in real time the presence of pesticides in a fresh tomato sample? Starting from today, thanks to Hydra, companies can examine a fresh tomato sample, understand if it is a truly organic tomato and decide whether to process it or discard it.

Hydra + Tomato = ❤

The advantage of monitoring the presence of pesticides in a tomato sample taken from the supplier’s truck is priceless. The transformation process of tomato is very fast: you cannot wait a few days to get the results from the laboratory. On the other hand, there are no valid alternative tools on the market that can detect the presence of pesticides in fresh or processed tomatoes in real time, until today.

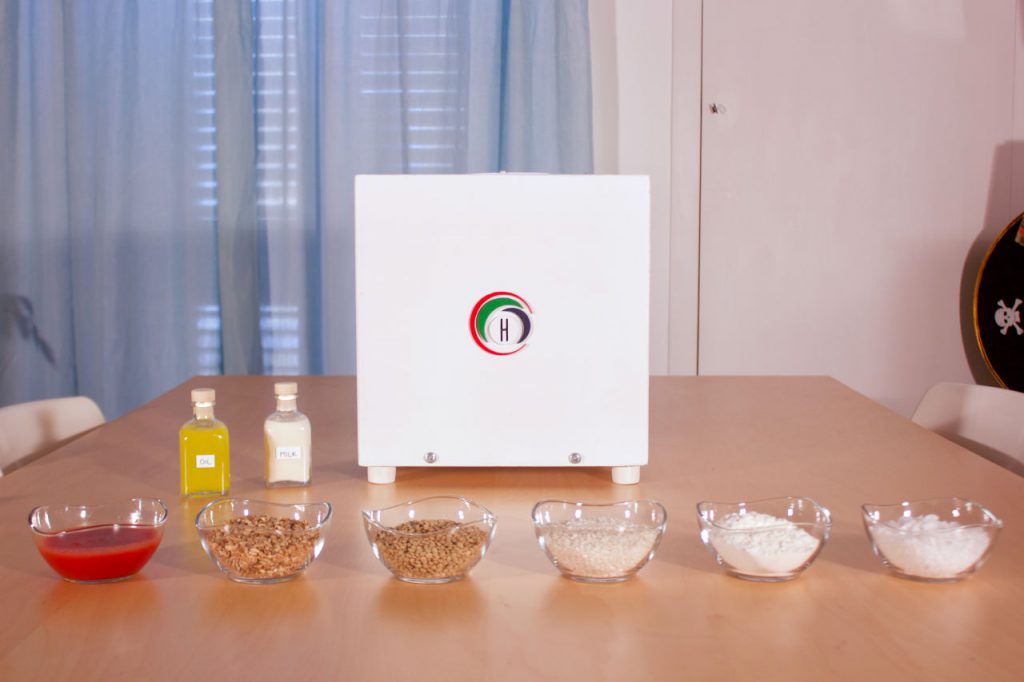
Caronte Consulting has designed and built Hydra, an innovative UV-VIS spectrometer, able to examine in real time the spectrum in the finished product, in the semi-finished products and in the transformation wastes of the food chain.

Hydra for laboratory Cover Teaser 2

Figure 1. Hydra for laboratory.

In particular, with tomatoes you can:

  • monitor the presence of pesticides;
  • determining the product characteristics (eg. sugar, lactic acid, lycopene, beta-carotene, etc.) in the raw material, in the semi-finished product and in the finished product;
  • examine the stability of the output product.

Pesticides

Nowadays pesticides are widely used in agriculture to protect crops and seeds. Unfortunately, their use has also introduced serious damage to the environment and human health [4]. Pesticides are invisible and cannot be analyzed by visible observation or simple tests; the estimation of pesticides in soil and food requires the intervention of an analysis laboratory, complex techniques and a lot of effort [5].

Hydra does not replace the analysis laboratory, but helps the operator to identify the batches of raw material that deserve an in-depth analysis (in the laboratory) before being processed.

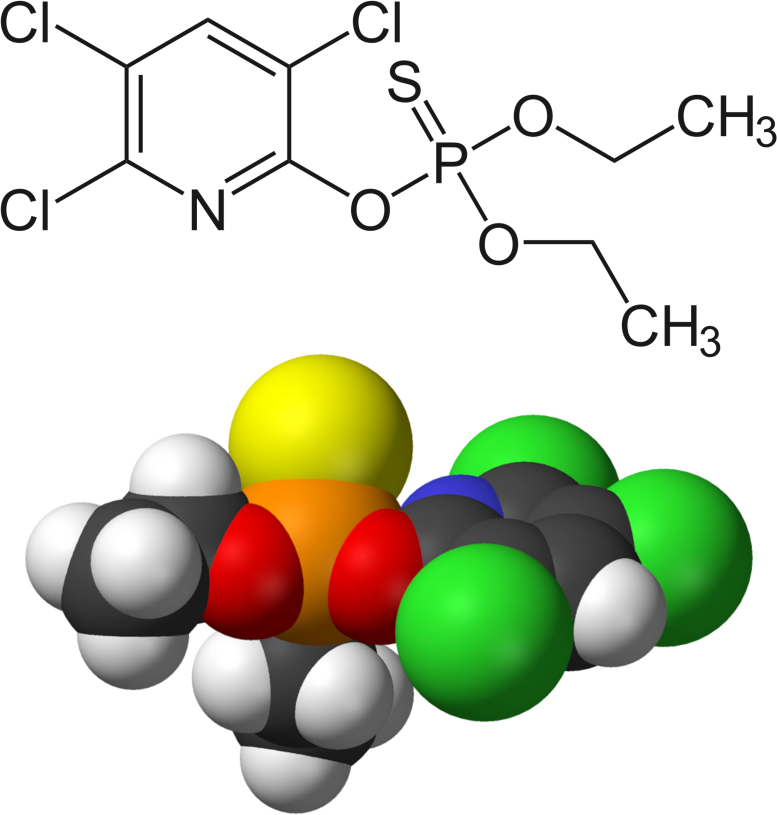
Molecule CLORPIRIFOS

Figure 2. Structure and molecule of Chlorpyrifos (source: Wikipedia).

Chlorpirifos

There are several thousand pesticide molecules to be analyzed [6] [7] but we cannot test them all! We therefore decided to elect Chlorpyrifos as a representative of organophosphate pesticides, comparing the spectral information obtained from pesticide-free tomatoes and those obtained from contaminated tomatoes, looking for particular traces that could be characteristic of organophosphate pesticide contamination.

Chlorpyrifos is used to kill parasites, insects and worms. It is used on crops, animals and buildings. It was introduced in 1965 by the Dow Chemical Company. It acts on the nervous system of insects by inhibiting acetylcholinesterase.

Analysis

We performed 2types of analysis:

  • on the fresh and blended San Marzano tomatoes;
  • on tomato sauce.

In both analyzes we added 0.05 ml of Chlorpyrifos to a sample of 76.35 ml, obtaining 76.4 ml of doped product at 0.065%. We have chosen an high doping to be able to identify with absolute certainty the points of the spectrum to be monitored to identify the presence of Chlorpyrifos.

Fresh tomatoes were washed thoroughly before being blended.

Fresh tomato + Chlorpirifos

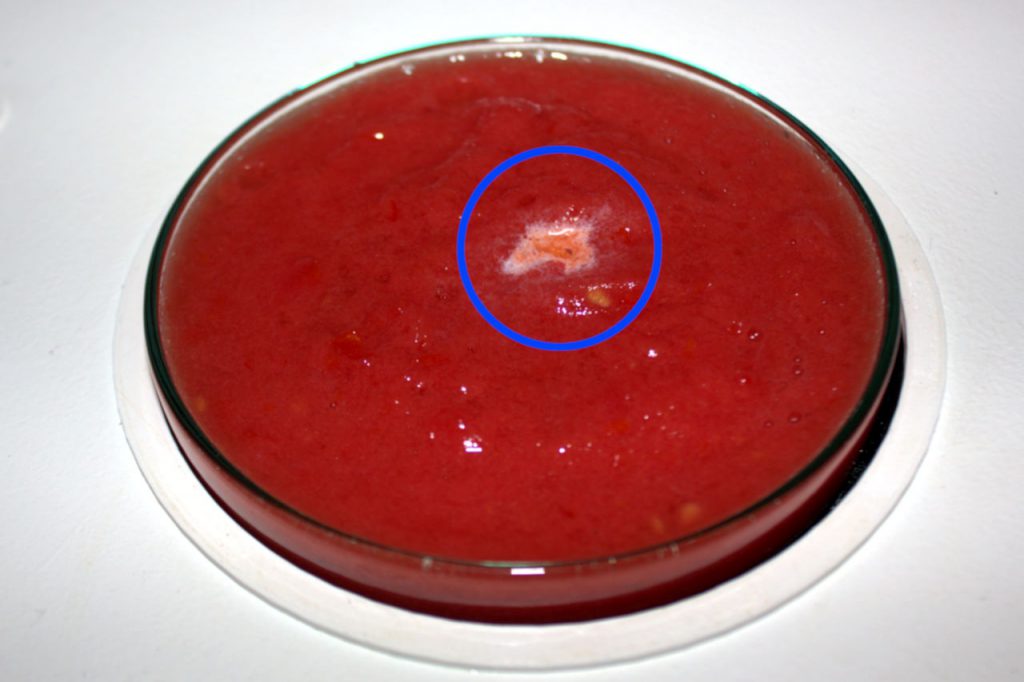
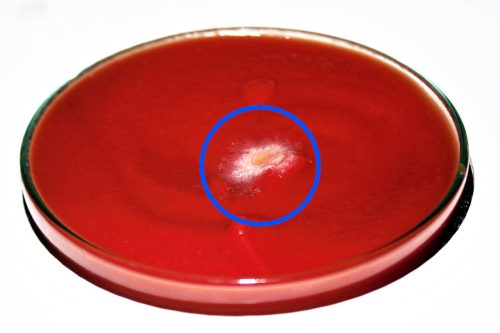
As shown in Figure 4, a single drop of Chlorpyrifos added to the blended tomato instantly determines a radical change in the color and in the structure of the sample, demonstrating a high reactivity of the pesticide.
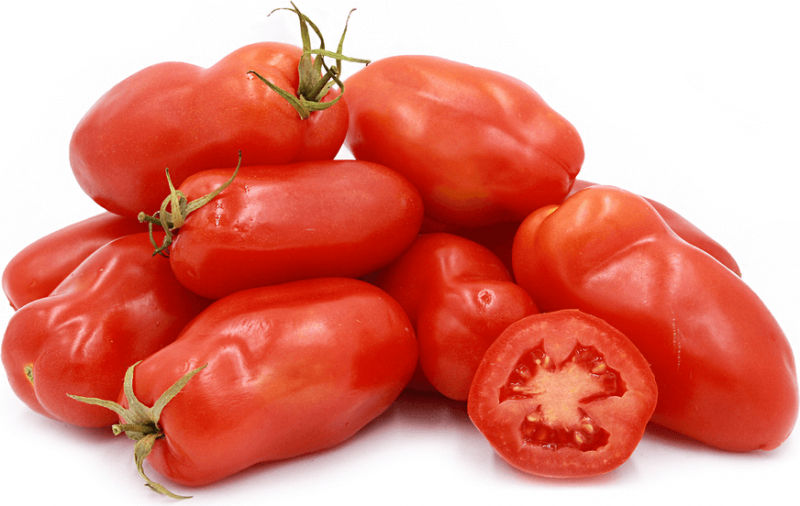
San Marzano tomato
Figure 3. Fresh San Marzano tomato.
Tomatoe puree + CLORPIRIFOS
Figure 4. A drop of Chlorpyrifos in fresh San Marzano tomato.
Fresh tomato + CLORPIRIFOS CSC
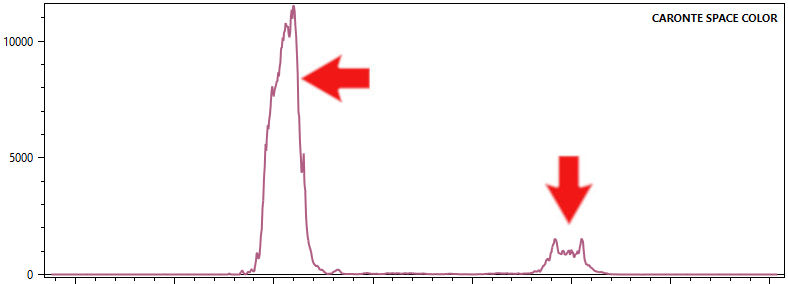
Figure 5. CSC curve of fresh tomato doped with pesticide. The peaks correspond to the characteristic frequencies of Chlorpirifos in the tomato.
Fresh tomato + CLORPIRIFOS details
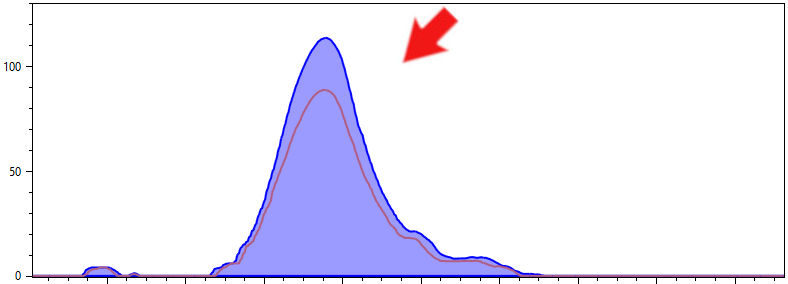
Figure 6. Comparison of a portion of the spectrum of a fresh tomato and the same one doped with pesticide.

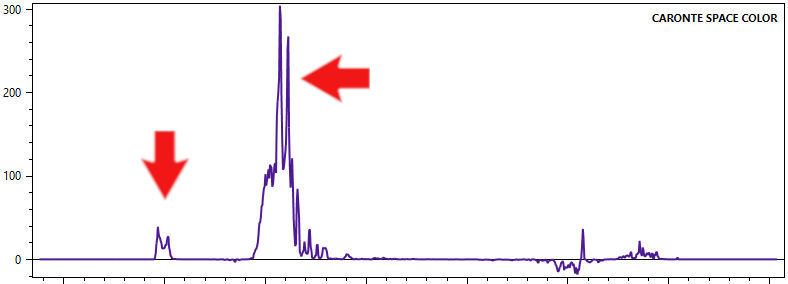
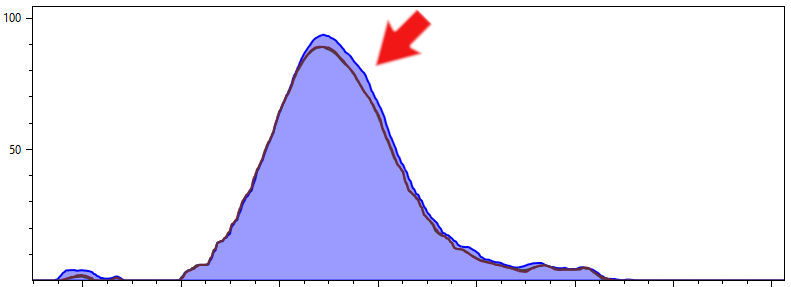
The analysis performed by Hydra lasts a few seconds and shows 2 very specific spectral areas, in Figure 5 and Figure 6, which explain to the operator the unequivocal presence of pesticide.

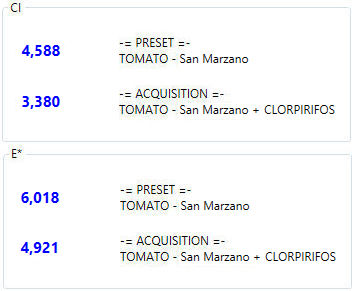
The numerical indexes speak clear: CI and E * clearly show, in Figure 7, a strong change in the presence of Chlorpyrifos doping.

Starting from these indexes, it is possible to create a customization of the software and generate a traffic light system (green, yellow, red) that helps the operator to assess at a glance the quality of the product or the need to deepen the analysis in a laboratory.

Figure 7. Comparison between numerical indexes CI and E*.

Tomato purée + Chlorpirifos

As can be seen in Figure 8, a single drop of Chlorpyrifos added to the tomato puree determines, in a few seconds, a radical change in the color and in the structure of the sample, demonstrating a high reactivity of the pesticide. The tomato purée was bought in a grocery store.
Tomatoe puree + CLORPIRIFOS
Figure 8. A drop of Chlorpyrifos in the tomato purée.

Spectrum

The analysis performed with Hydra lasts a few seconds and shows 2 very precise spectral areas, in Figure 9 and Figure 10, which explain to the operator the unequivocal presence of pesticide.

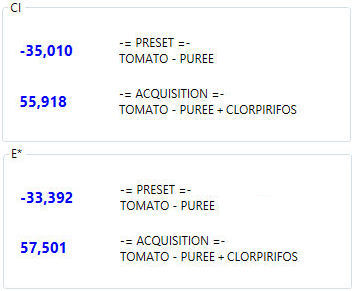
The numerical indexes talk clear: CI and E* are clearly visible, in Figure 11, a sign inversion in the presence of Chlorpyrifos doping.

CLORPIRIFOS Spectrum CSC

Figure 9. CSC curve of tomato purée doped with pesticide. The peaks correspond to the characteristic frequencies of Chlorpirifos in the tomato purée.

CLORPIRIFOS Spectrum details

Figure 10. Comparison of a portion of the spectrum of a tomato purée and the same one doped with pesticide.

The numerical indexes talk clear: CI and E* are clearly visible, in Figure 11, a sign inversion in the presence of Chlorpyrifos doping.

Thanks to Hydra, now we know what frequencies we need to monitor and how the numerical indexes vary: we can identify very small variations that detect the presence of pesticides (Chlorpirifos).

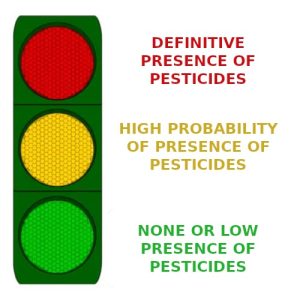
From these indexes, it is possible to create a customization of the software and generate a traffic light system (Figure 12) that helps the operator to assess at a glance the quality of the product or the need to deepen the analysis at a chemical laboratory.

Spectrum CLORPIRIFOS tomato purée indexes
Figure 11. Comparison between numerical indexes CI and E*.
Traffic light code
Figure 12. The numerical indexes can be summarized in a traffic light code, useful for the operator.

References

Our experiments and our deductions have drawn particular inspiration from the work of: Stagno C. “Caratterizzazione dei sottoprodotti della filiera del pomodoro per un potenziale sviluppo industriale“, Università degli Studi di Ferrara, 2010.

[1] Oumy Diop, Umberto Cerasani, “Light Reflection Spectrum Comparison of Pesticides Free Foods, Organic Foods and Conventional Farming Foods for VIS NIR Filter Creation”, CENTRIC 2016, pp 42-49

[2] Wen Li, Ming Sun, Minzan Li, “A survey of determination for organophosphorus pesticide residue in agricultural products”, Advance Journal of Food Science and Technology 5(4): 381-386, 2013

[3] Yankun Peng, Yongyu Li and Jingjing Chen (2012). Optical Technologies for Determination of Pesticide Residue, Infrared Spectroscopy – Materials Science, Engineering and Technology, Prof. Theophanides Theophile (Ed.), ISBN: 978-953-51-0537-4, InTech

[4] D. Pimentel, “Environmental and economic costs of the application of pesticides primarily in the United States”, Environment, development and sustainability, vol. 7, pp. 229-252, 2005.

[5] D. Yang and Y. Ying, “Applications of Raman spectroscopy in agricultural products and food analysis: a review”, Applied Spectroscopy Reviews, vol. 46, pp. 539-560, 2011.

[6] L. R. Goldman, “Managing pesticide chronic health risks: US policies”, Journal of agromedicine, vol. 12, pp. 67-75, 2007.

[7] C. f. D. C. a. Prevention. (2013). CDC – Pesticide Illness & Injury Surveillance – NIOSH Workplace Safety and Health Topic.

[8] Mughal BB, Fini JB, Demeneix BA, “Thyroid-disrupting chemicals and brain development: an update”, Endocr Connect 2018 Apr; 7(4):R160-R186. doi: 10.1530/EC-18-0029.

https://en.wikipedia.org/wiki/Tomato

https://en.wikipedia.org/wiki/Chlorpyrifos

Would you like to know more?

If Hydra for laboratory intrigues you and you want to know more about how it works, you can contact us in several ways: choose the one you like best. We will be happy to give you all the infos you need, without binding you to any purchase.

PHONE

EMAIL

MESSENGER

WHATSAPP

Discover some of our products

Caronte Consulting designs and manufactures hardware and software systems in the field of Industry 4.0, equipped with sophisticated and effective Artificial Intelligence.

Our devices are tailor-made to the customer’s needs and allow you to completely automate industrial processes, optimizing production and creating savings in raw materials and energy consumption.